Quickstart
LandmarksWidget is the interactive surface for tissue coordinates in
AnnData or SpatialData. Open it with milume.peek, draw a selection, then
read hits back into the notebook with synced traitlets.
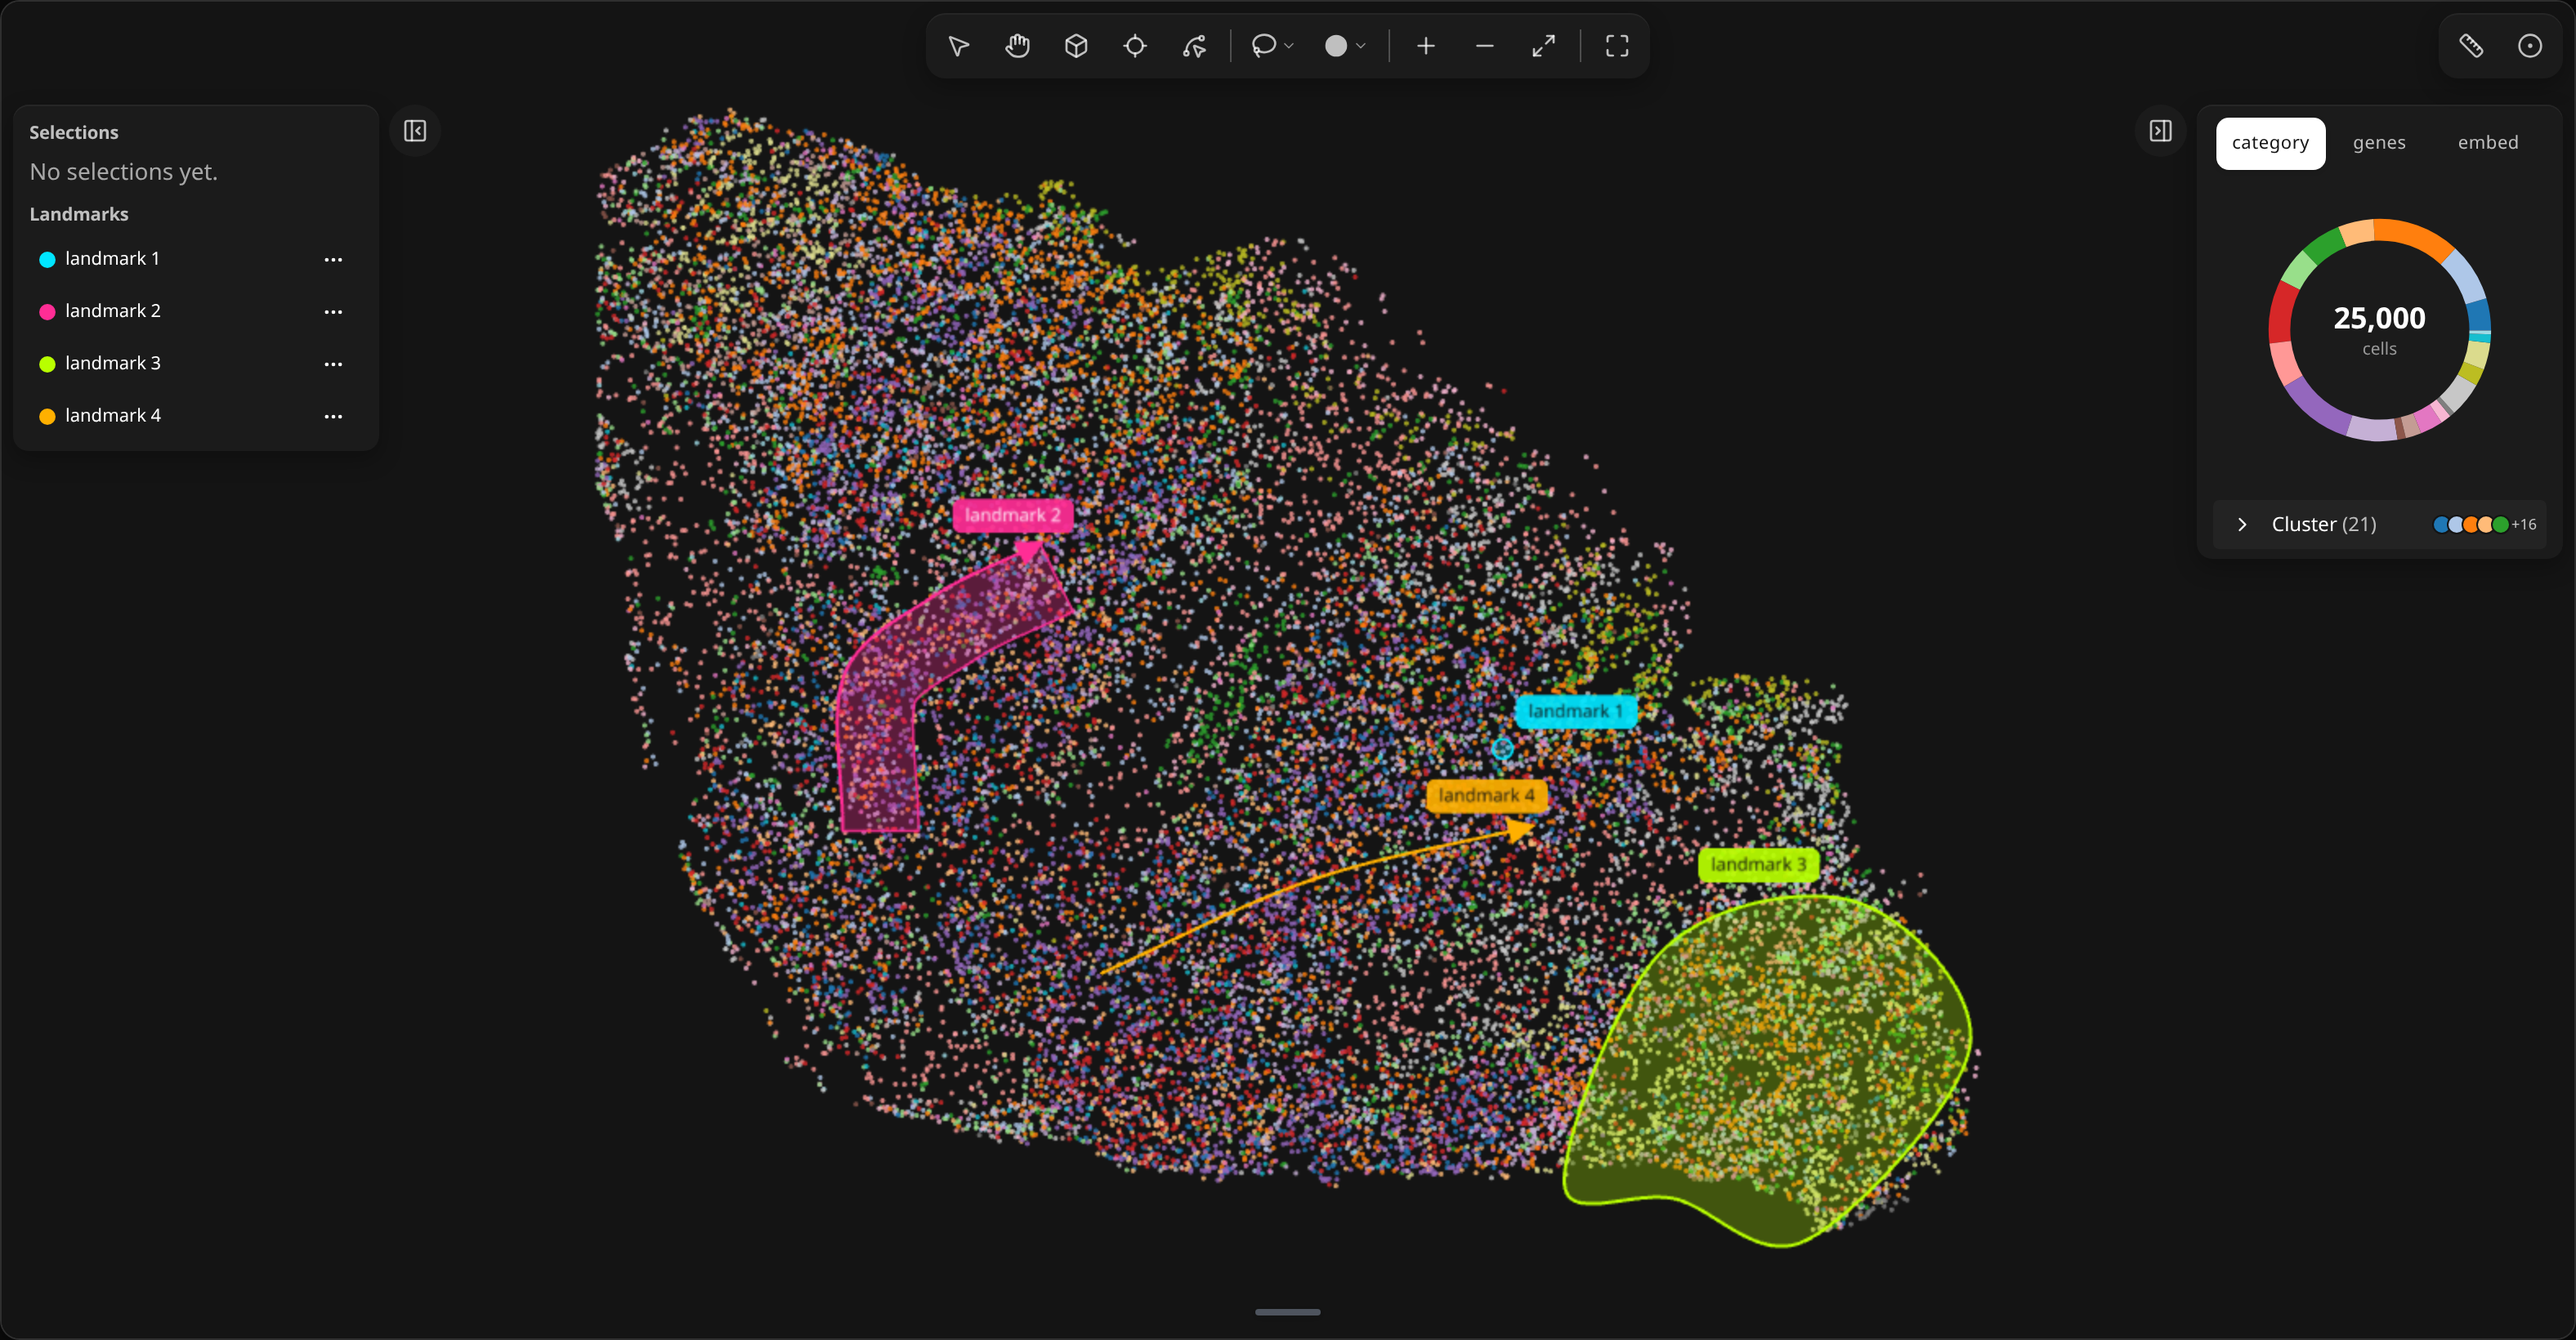
Open the widget
Coordinates must live in obsm["spatial"] (or the table’s spatial key on
SpatialData):
import milume

w = milume.peek(adata, color="cell_type")
w = milume.peek(sdata, color="cell_type")  # table, labels, image inferred
Use selections downstream
w.selections updates on every edit in the browser. After you draw a region,
join to observations by name (not row index):
import pandas as pd

sel_id = w.selections[-1]["id"]
hits = w.get_obs_names(adata, sel_id)
adata.obs["in_lasso"] = adata.obs_names.isin(hits)

# or write a boolean column in one call
w.assign_obs_mask(adata, "in_lasso", selection_id=sel_id)

summary = pd.DataFrame({"cell_type": adata.obs.loc[hits, "cell_type"].value_counts()})
Landmarks (w.landmarks) are durable geometric annotations; selections are
analysis regions. See the API reference for traitlets and
methods.