Measure
Quantify landmarks and selections in Python. Every function returns a tidy pandas.DataFrame with one row per cell (or per group).
Setup
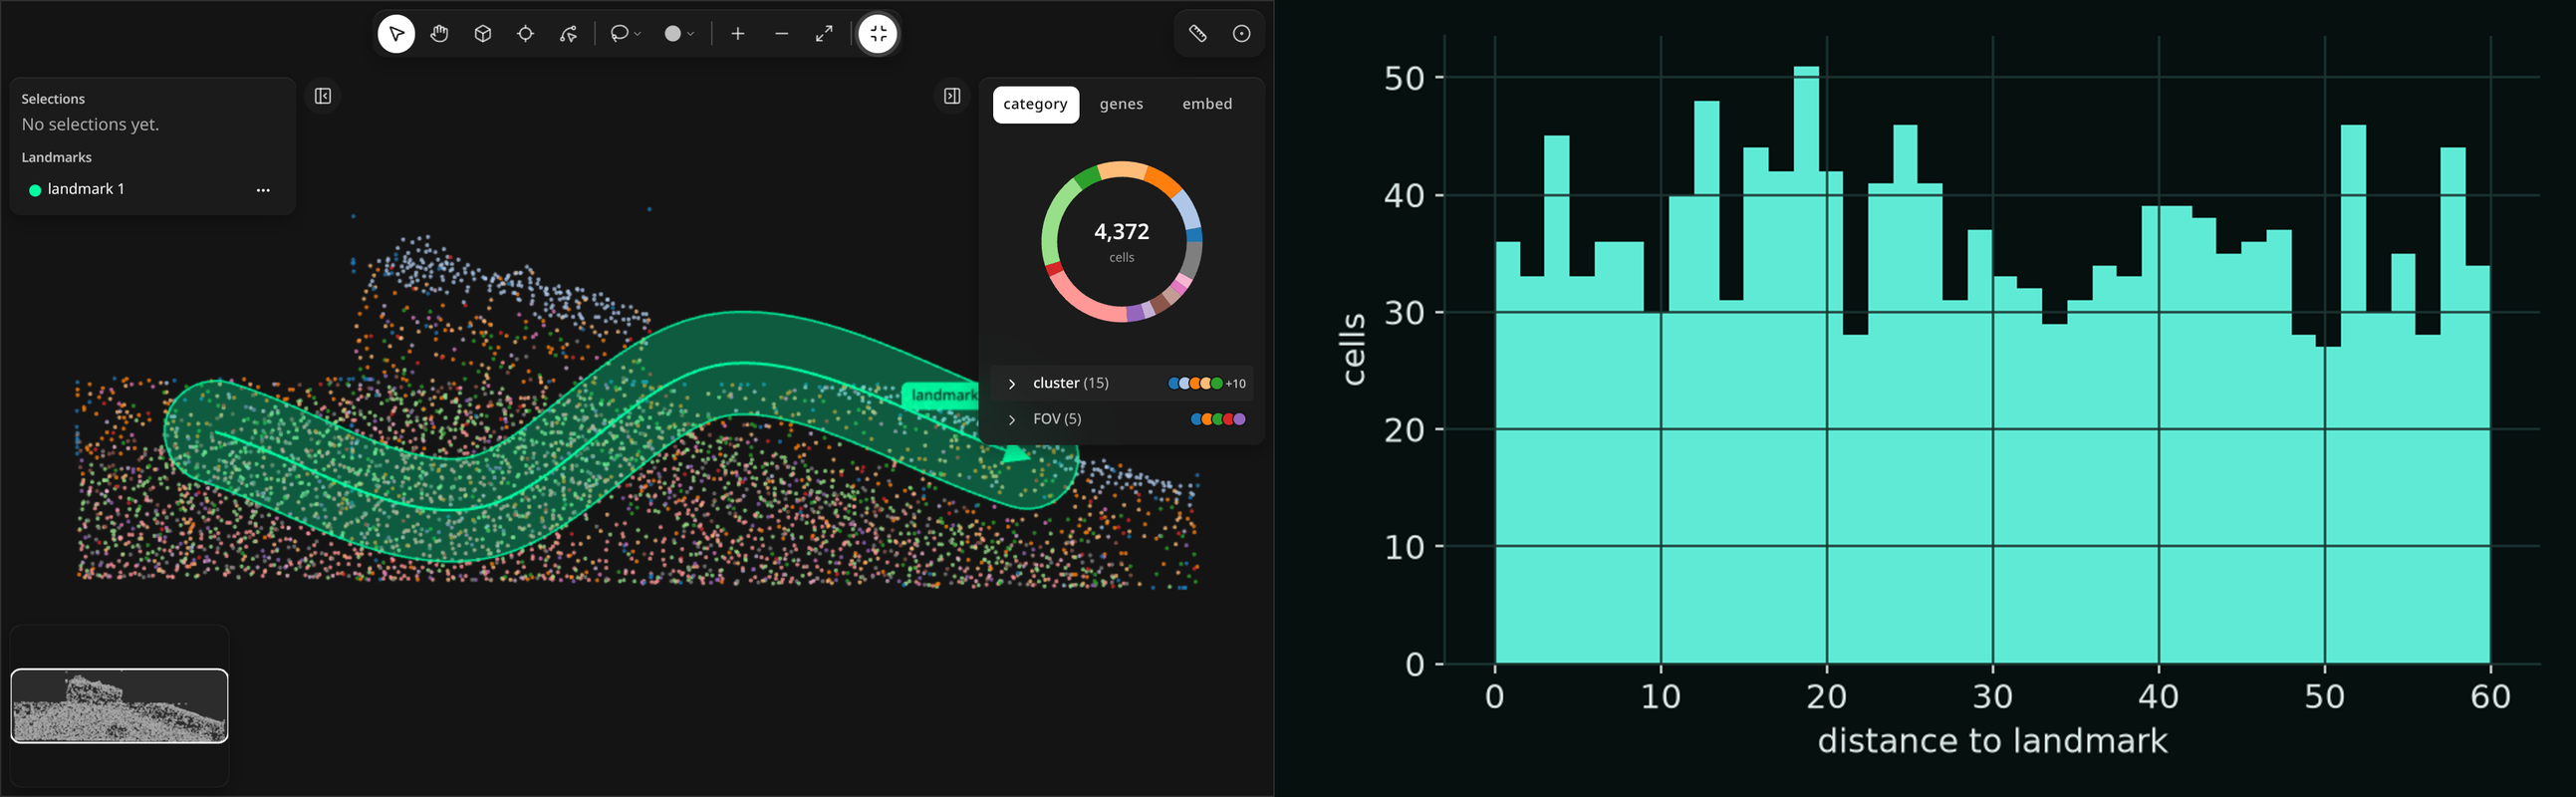
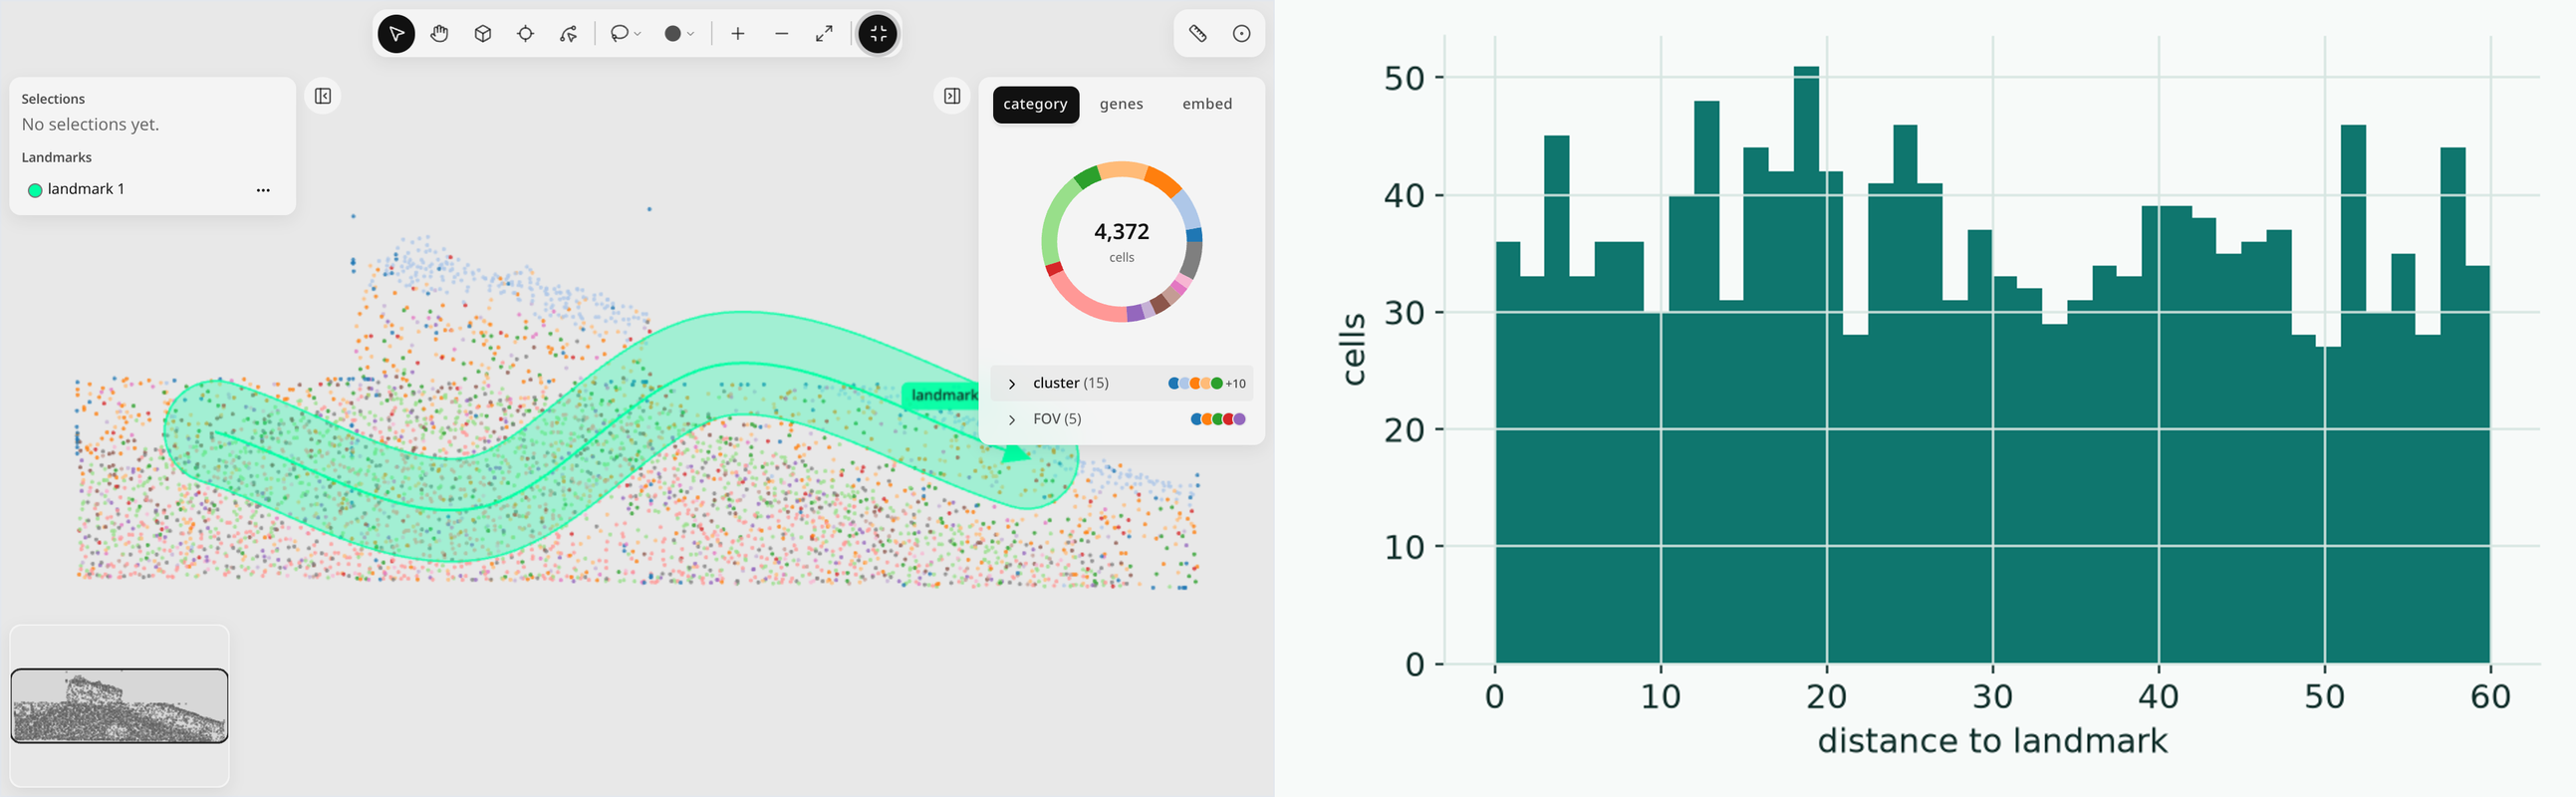
Draw a landmark (for example a spline, key 3) and a selection, then build a GeoDataFrame from the widget (needs geopandas):
import milume
from milume import landmarks_to_geodataframe
w = milume.peek(adata, color="cell_type")
gdf = landmarks_to_geodataframe(w.landmarks)
sel = w.get_obs_names(adata, w.selections[-1]["id"])
obs_key names the obs column to group cells by; every output has a group column with its values. When obsm["spatial"] has x, y and z, the outputs also carry z and z_bin (1 µm bins by default, z_bin_size=None turns them off).
distances
distances(adata, landmarks, *, obs_key, spatial_key="spatial", obs_names=None, z_bin_size=1.0)
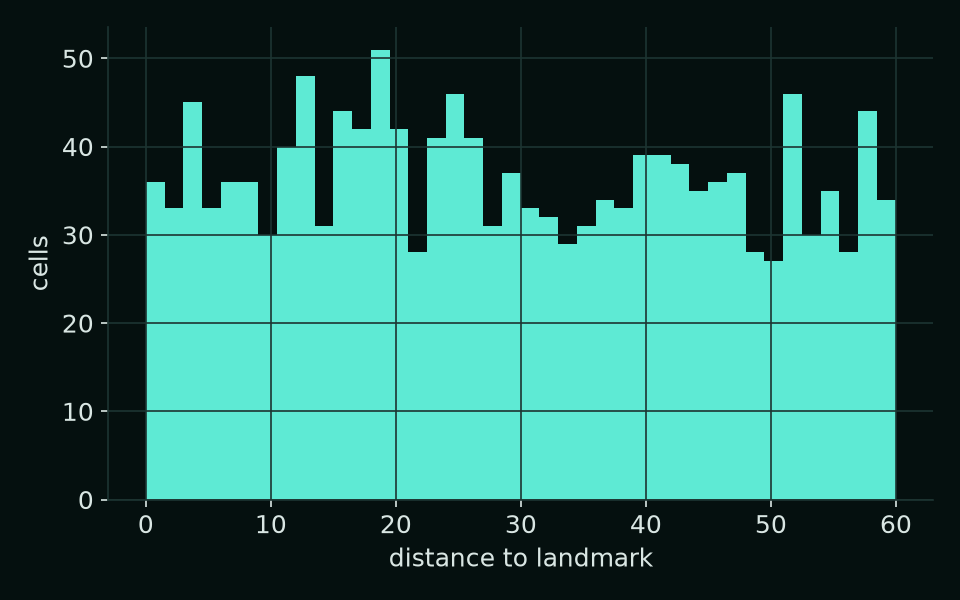
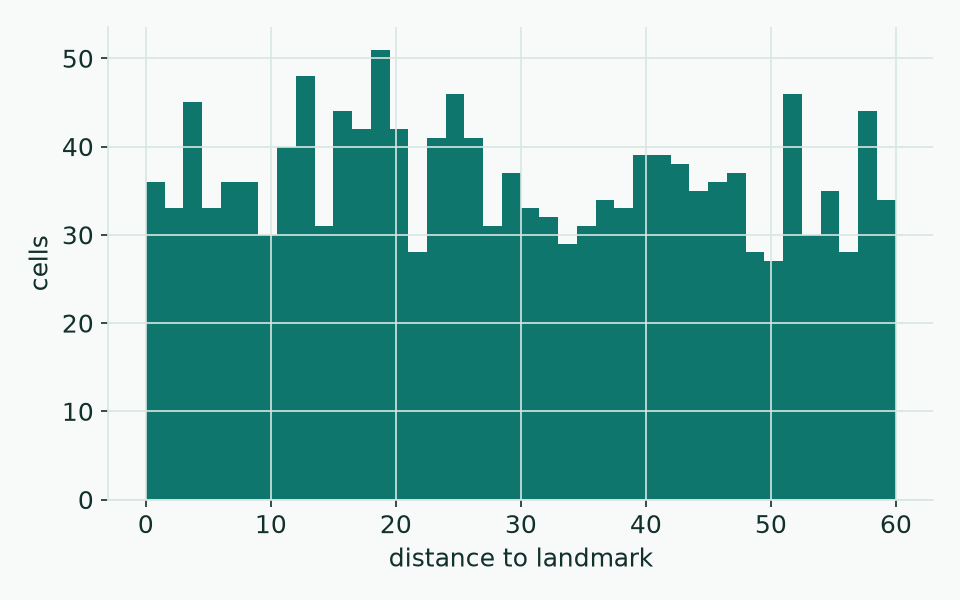
Per-cell distance to each landmark's geometry. A line or spline with a buffer only measures cells inside the buffer.
from milume import distances
d = distances(adata, gdf, obs_key="cell_type")
d[["obs_name", "landmark_id", "group", "distance"]]
composition
composition(adata, landmarks, *, obs_key, spatial_key="spatial", obs_names=None, z_bin_size=1.0)
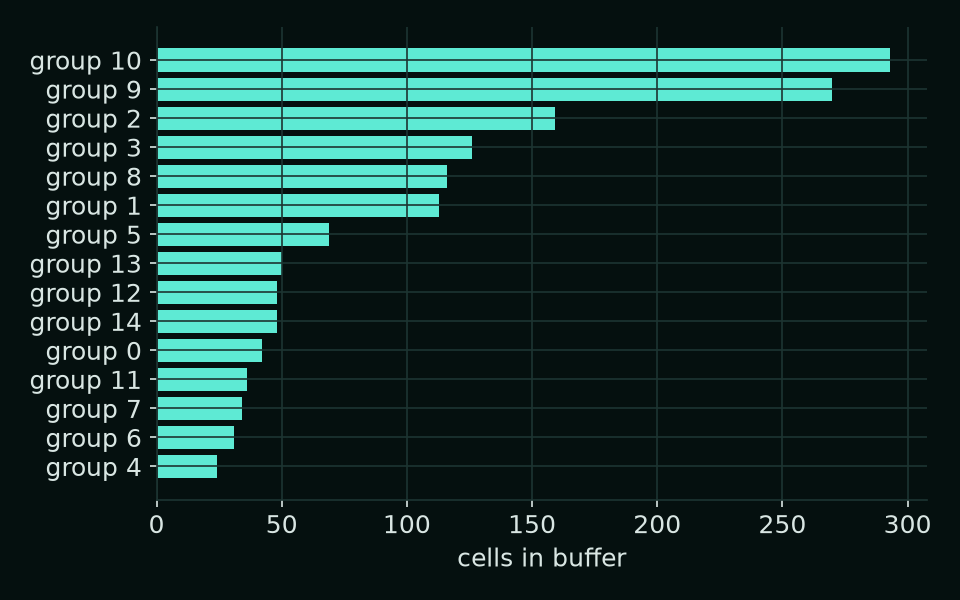
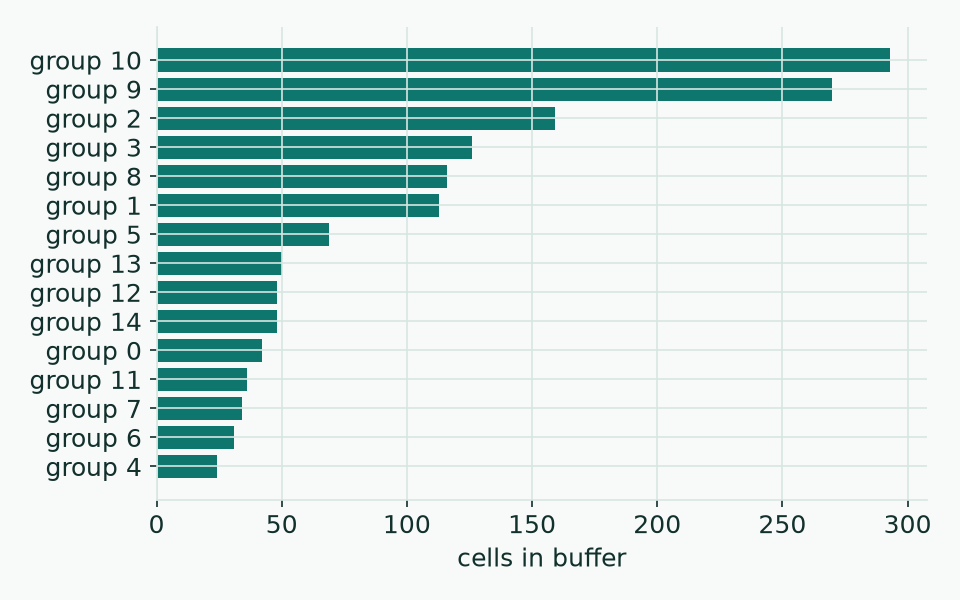
Counts and proportions of each group inside a shape or a line's buffer.
from milume import composition
c = composition(adata, gdf, obs_key="cell_type")
c.groupby("group")["count"].sum()
along_positions
along_positions(adata, landmarks, *, obs_key, spatial_key="spatial", obs_names=None, radius=None, z_bin_size=1.0)
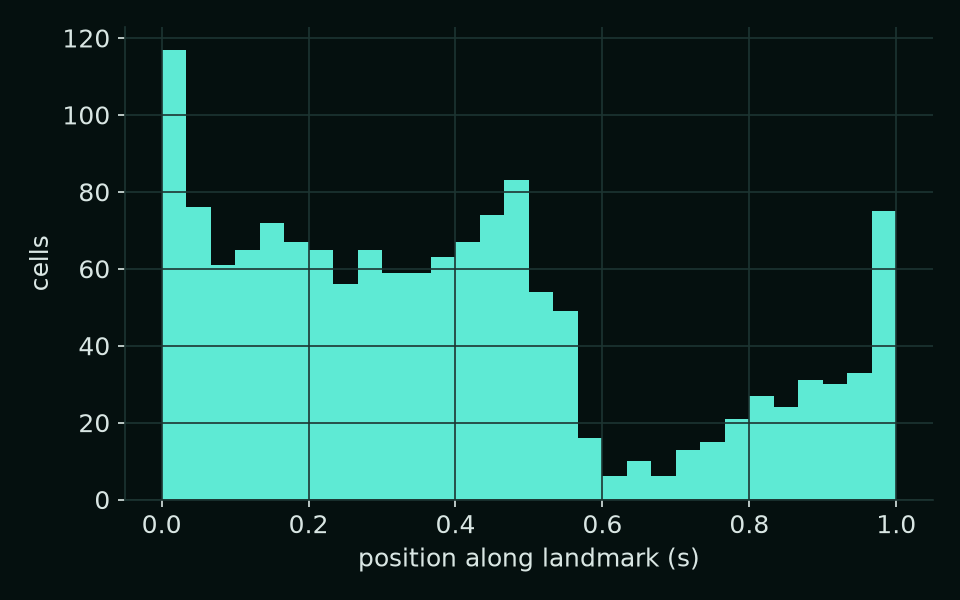
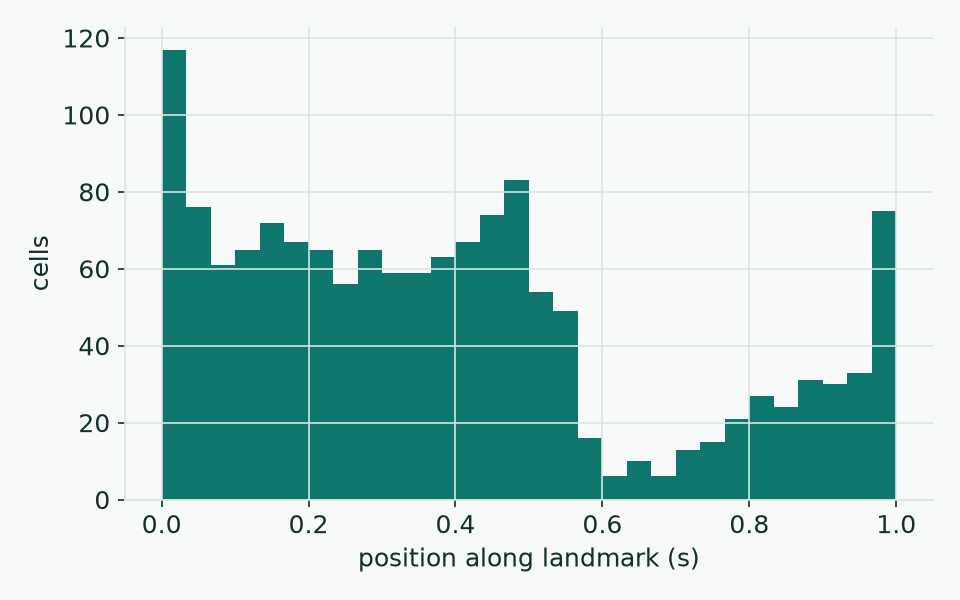
Projects cells onto a line or spline as a normalized arc position s from 0 (start) to 1 (end).
from milume import along_positions
s = along_positions(adata, gdf, obs_key="cell_type")
s[["obs_name", "group", "s", "distance"]]
enrichment
enrichment(adata, obs_names, *, obs_key, background=None)
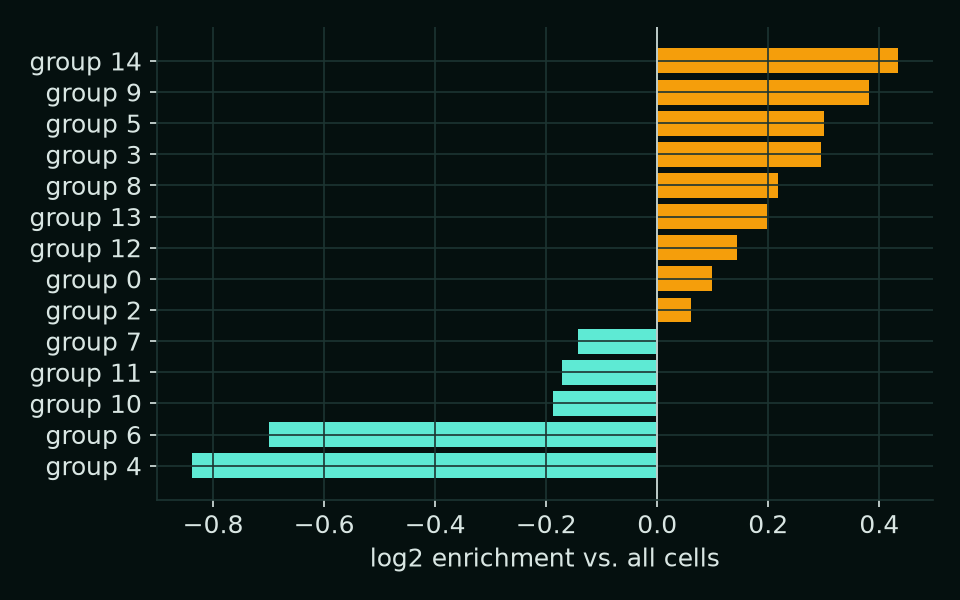
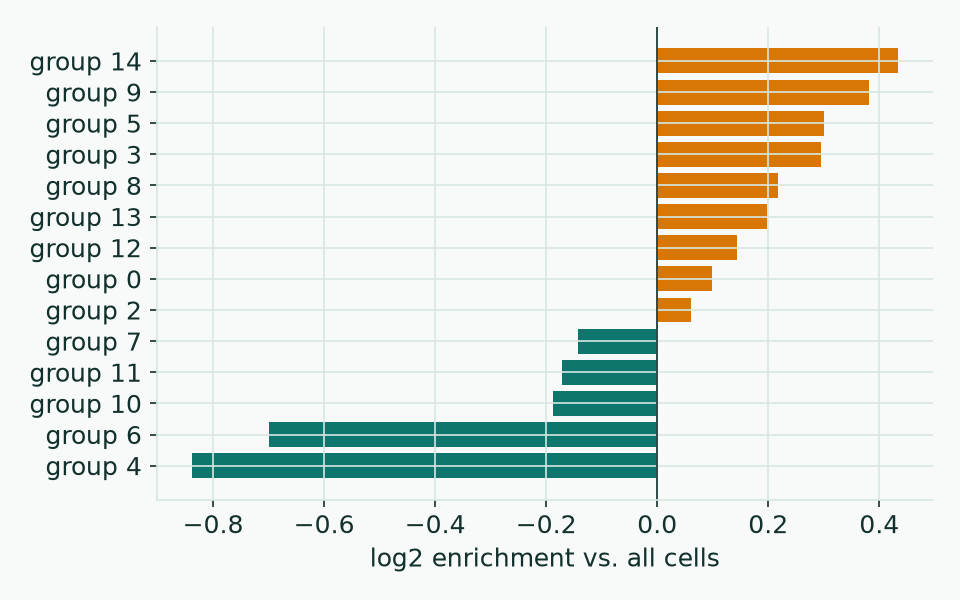
Group composition of a cell subset (such as a selection) against a background, all cells by default.
from milume import enrichment
e = enrichment(adata, sel, obs_key="cell_type")
e[["group", "count", "proportion", "background_proportion", "log2_enrichment"]]
nearest_distances
nearest_distances(adata, seeds, *, obs_key, spatial_key="spatial", obs_names=None)
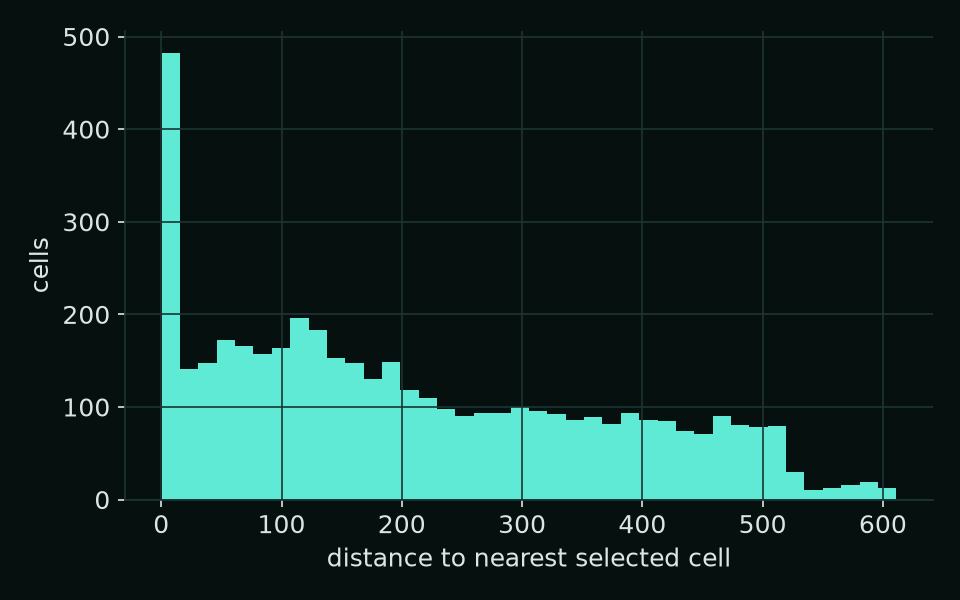
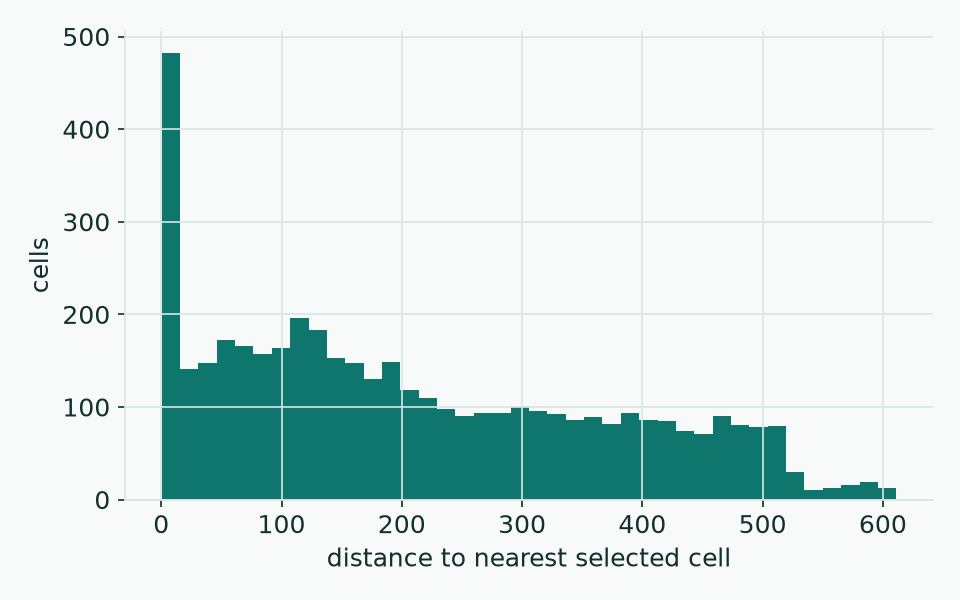
Distance from every cell to its nearest seed cell, in XY and in XYZ. Needs x, y, z in obsm["spatial"].
from milume import nearest_distances
n = nearest_distances(adata, sel, obs_key="cell_type")
n[["obs_name", "group", "seed", "distance_xy", "distance_xyz"]]
write_obs
write_obs(adata, df, column, value_col, *, obs_name_col="obs_name")
Writes a per-cell measurement back into adata.obs, aligned by obs_name. Cells missing from df stay NaN.
from milume import write_obs
write_obs(adata, d, "dist_to_landmark", "distance")
adata.obs["dist_to_landmark"].describe()
The new column works like any other obs column, for example in scanpy plots or as input to the next peek.