Color & layers
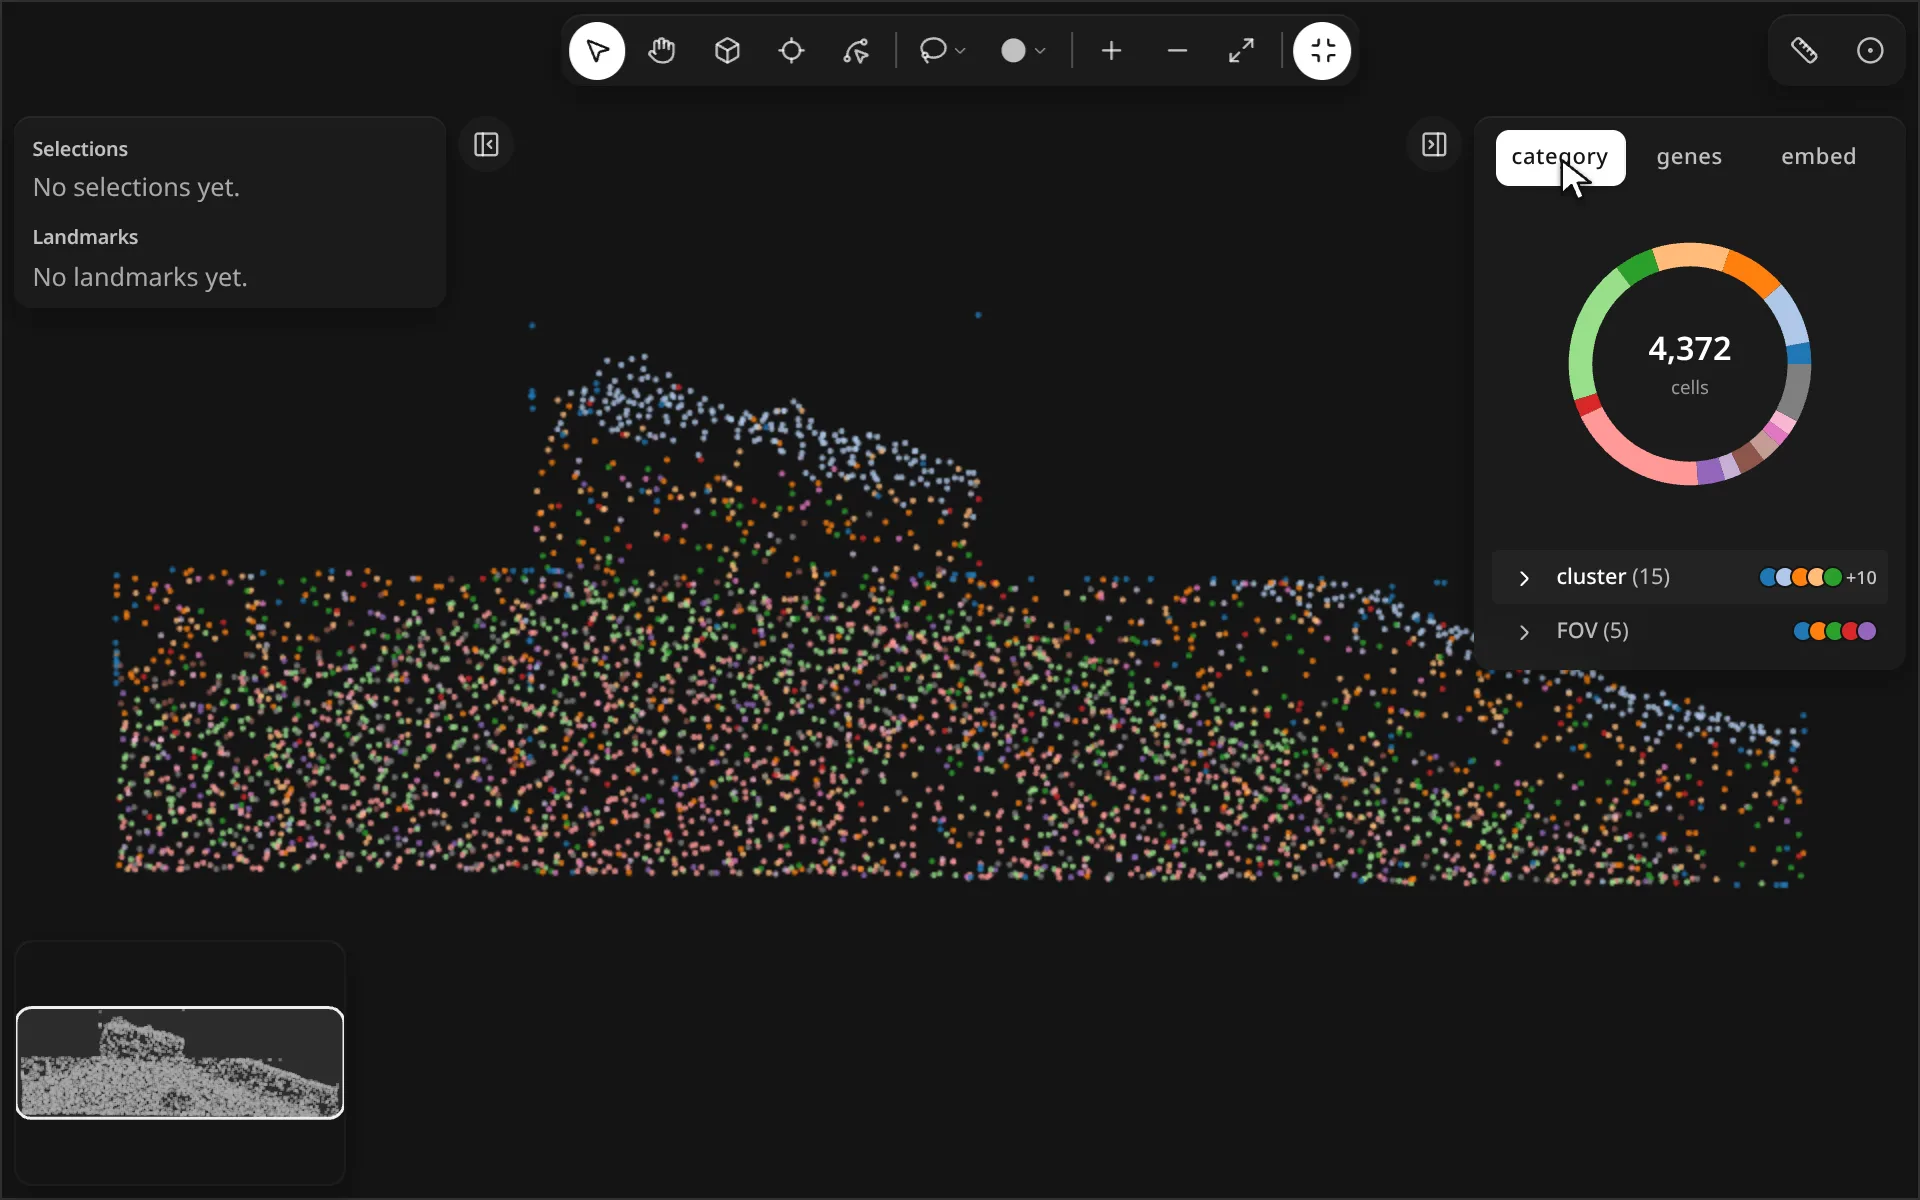
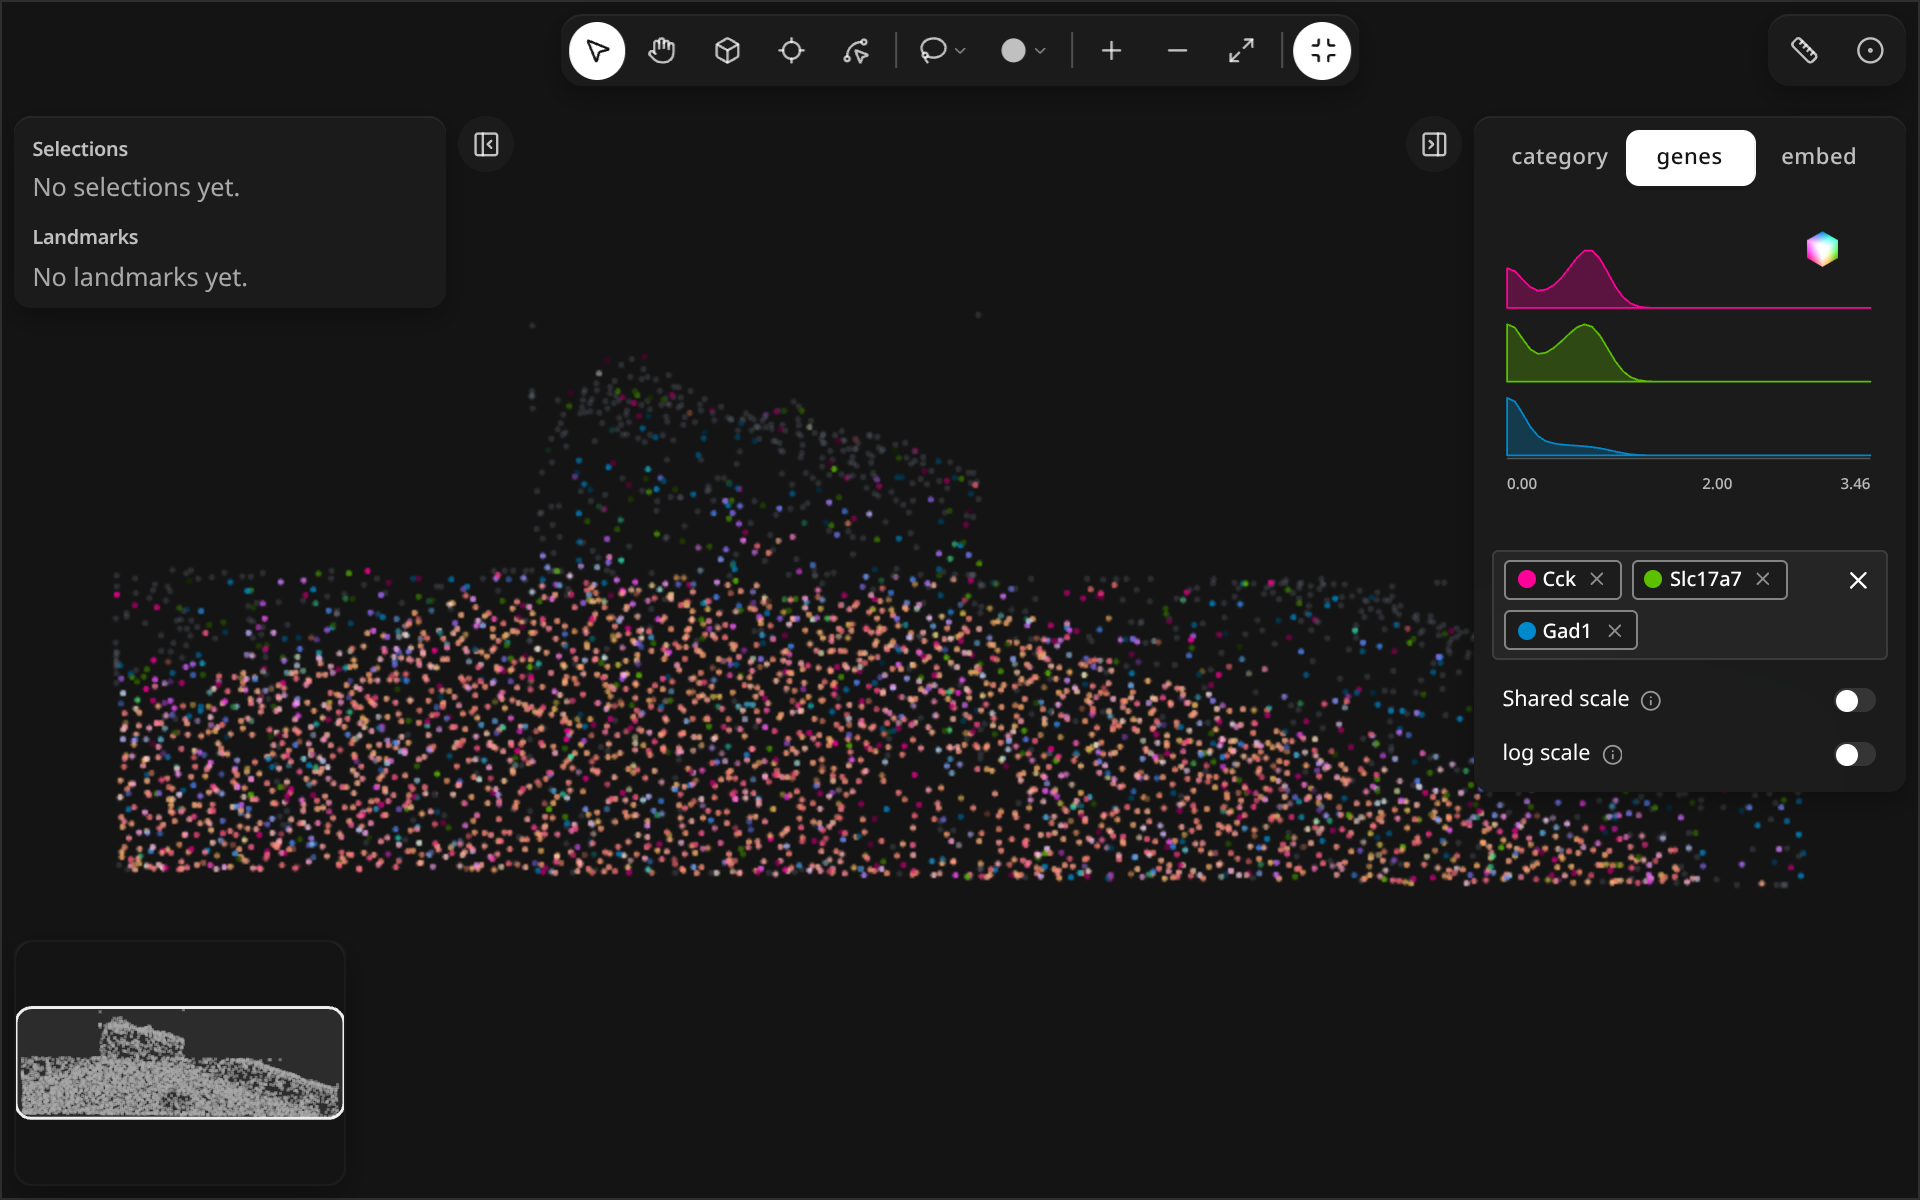
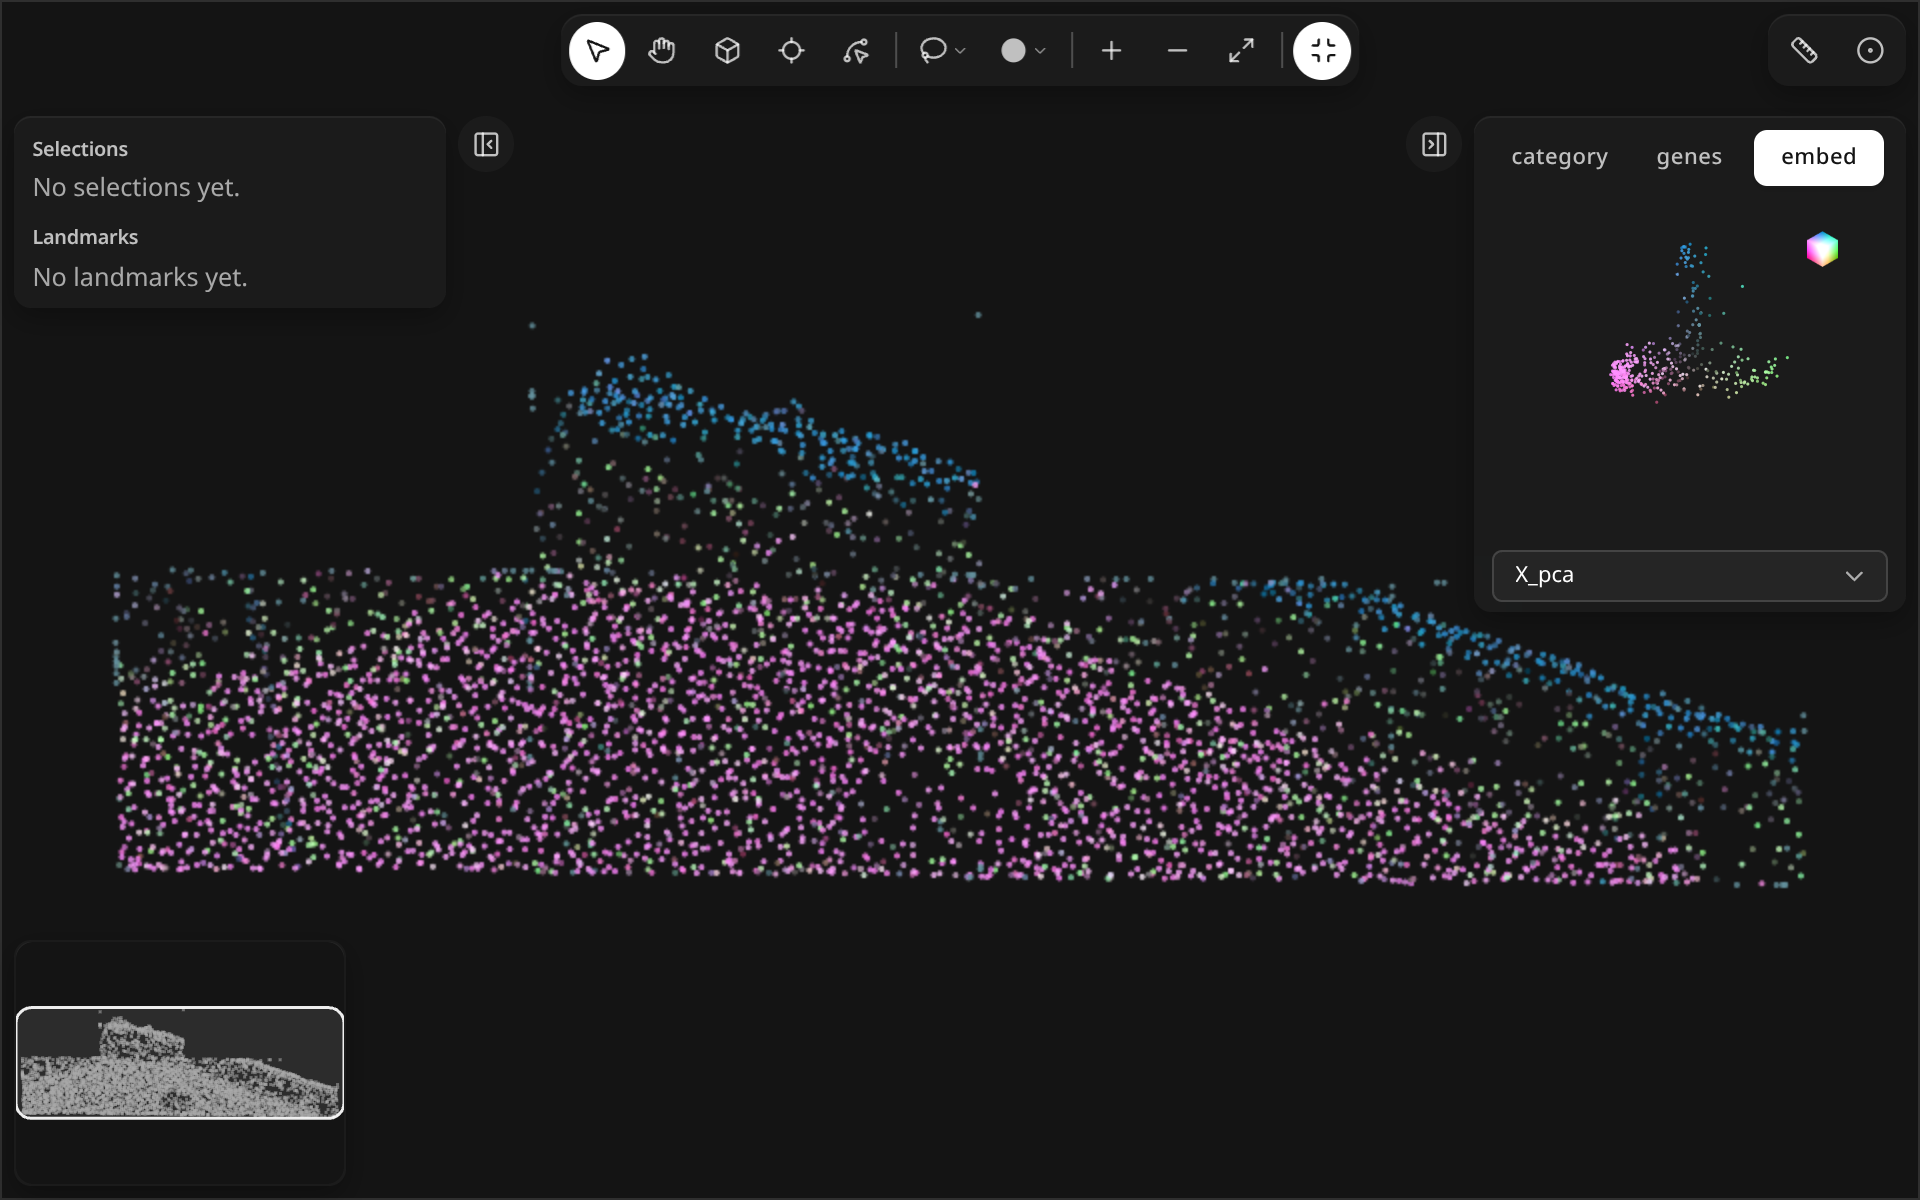
Switch the color panel between category, genes and embed; the map recolors to match.
import milume
w = milume.peek(adata, color="cell_type", genes=["GeneA", "GeneB", "GeneC"])
w.active_category, w.active_genes
Color tabs
The right panel has three pill tabs. They have no icons, so the table names each tab.
| Tab | What it colors by | |
|---|---|---|
| 1 | category | An obs category column. Expand it () to toggle single subcategories. |
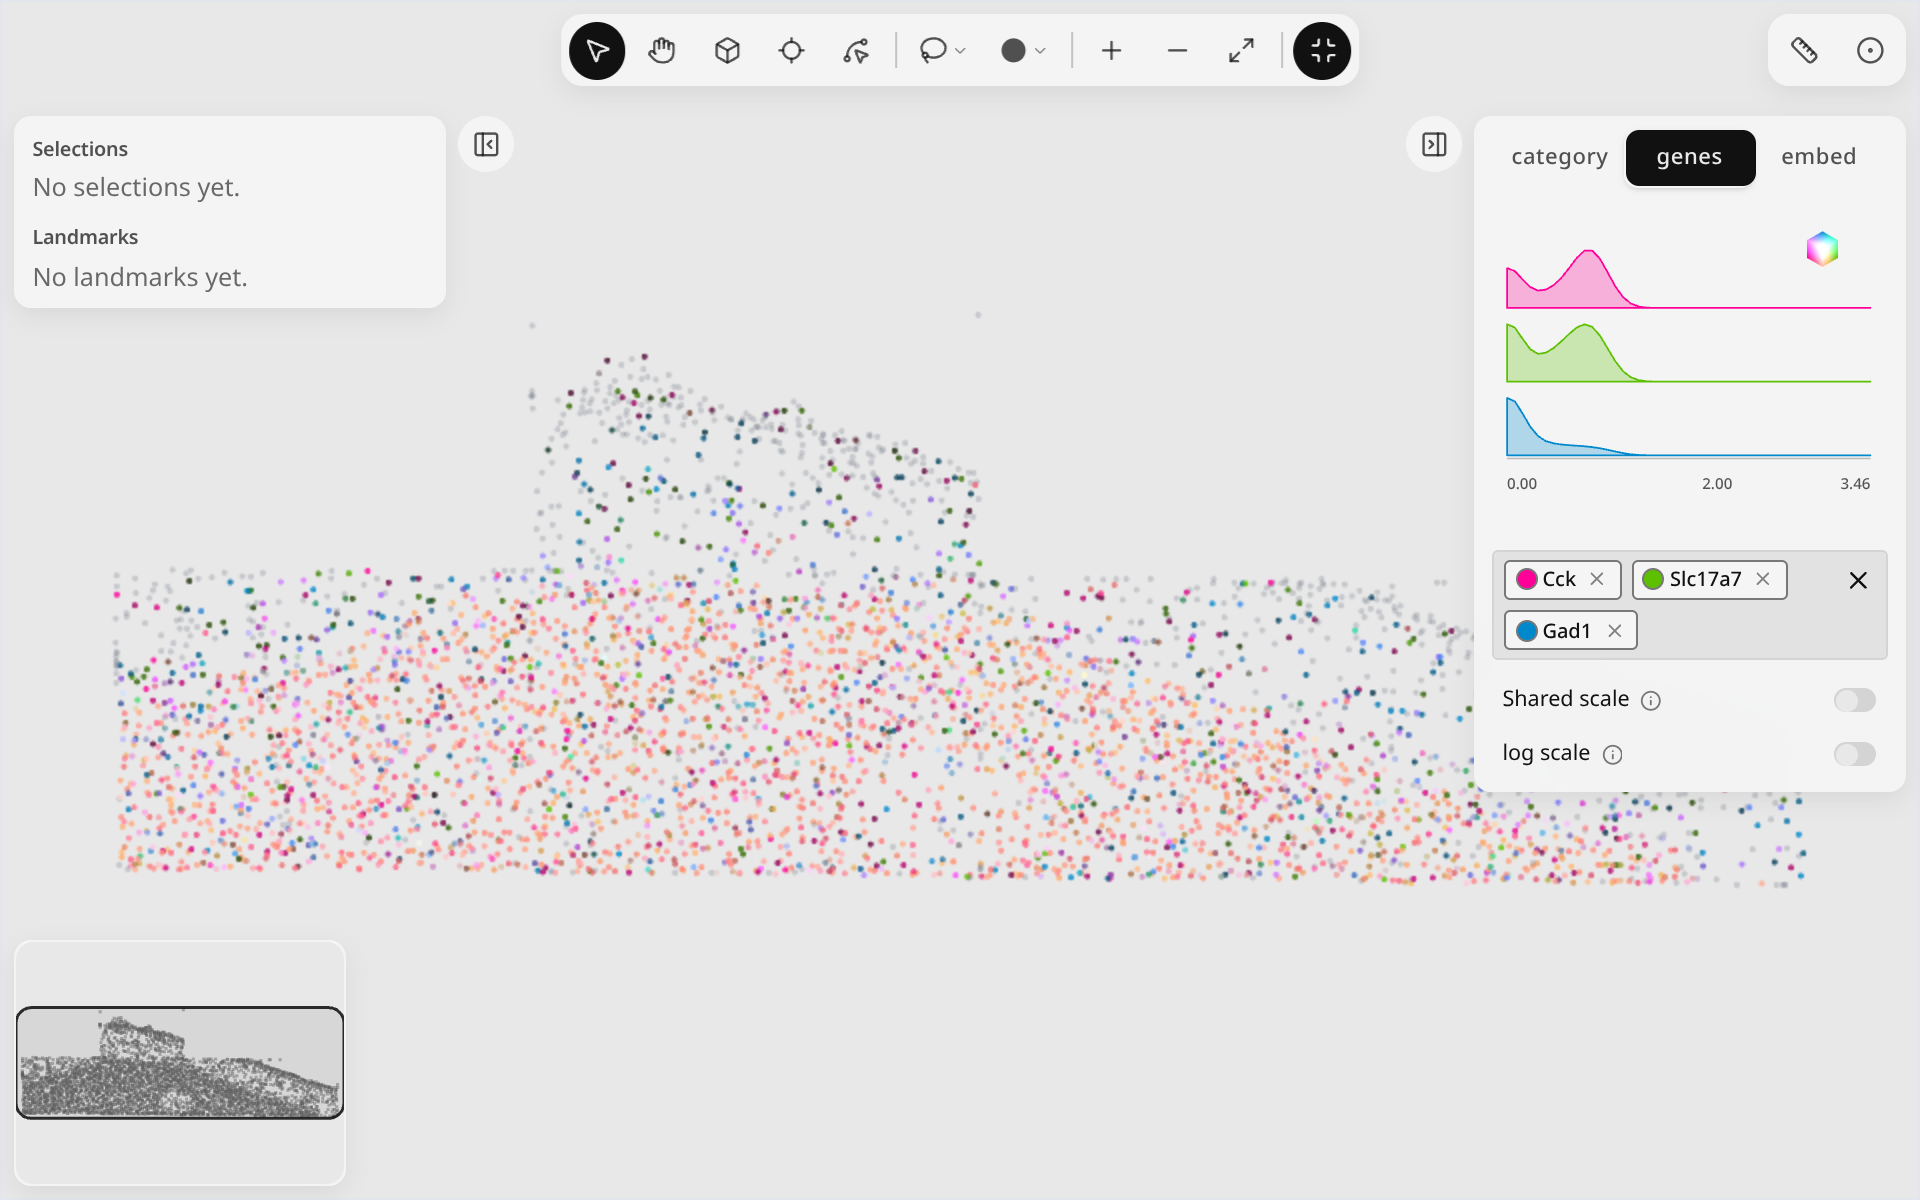
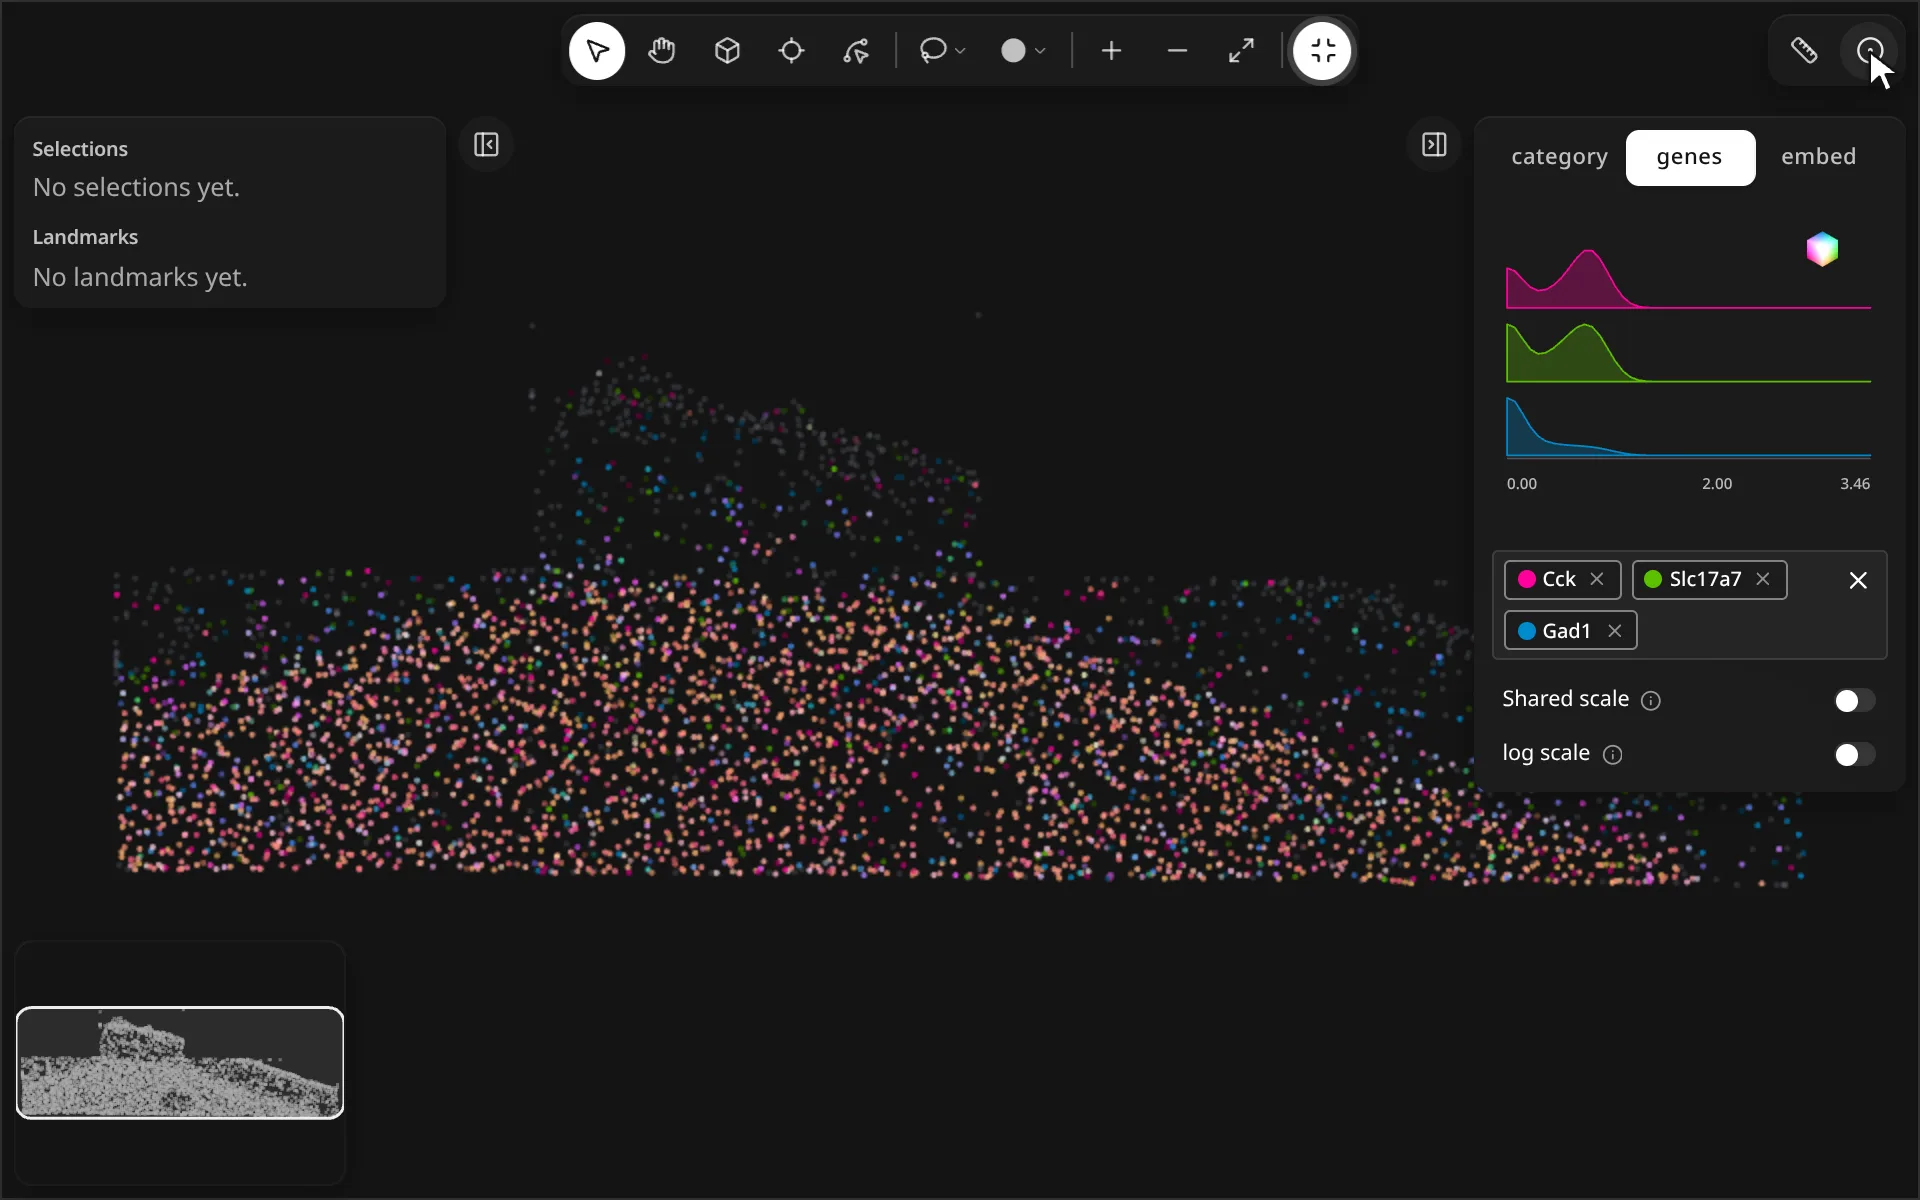
| 2 | genes | Expression of the picked genes, with ridgeline densities and a blend legend. Pick genes in the field under the legend. |
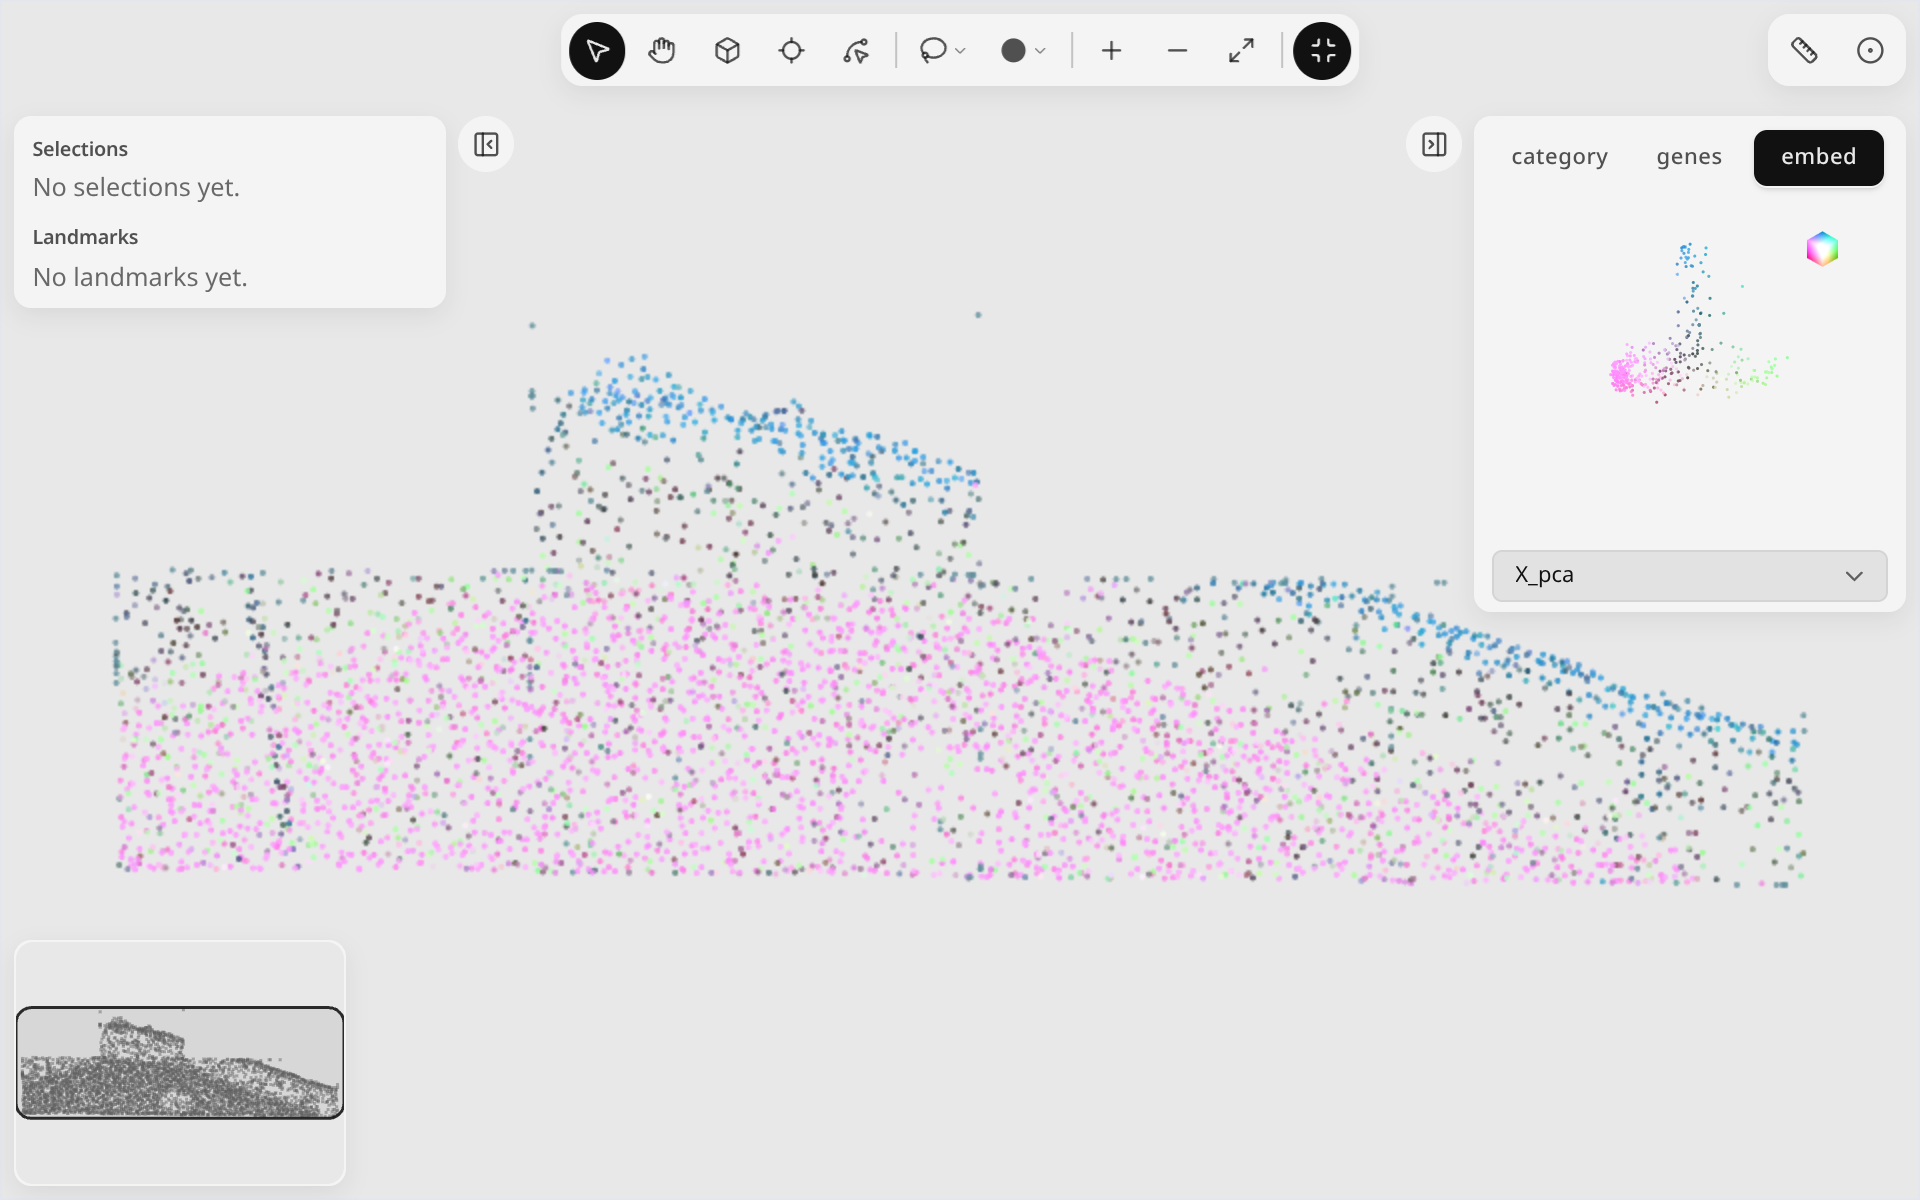
| 3 | embed | An embedding (for example X_pca) mapped to RGB, with an RGB-cube legend. Choose the embedding from the dropdown. |
genes
embed
Points ⇄ Raster
| Control | What it does | |
|---|---|---|
| points/raster | Flip between drawing each cell as a point and aggregating cells into raster bins (). The icon shows the current mode. |
Layers list
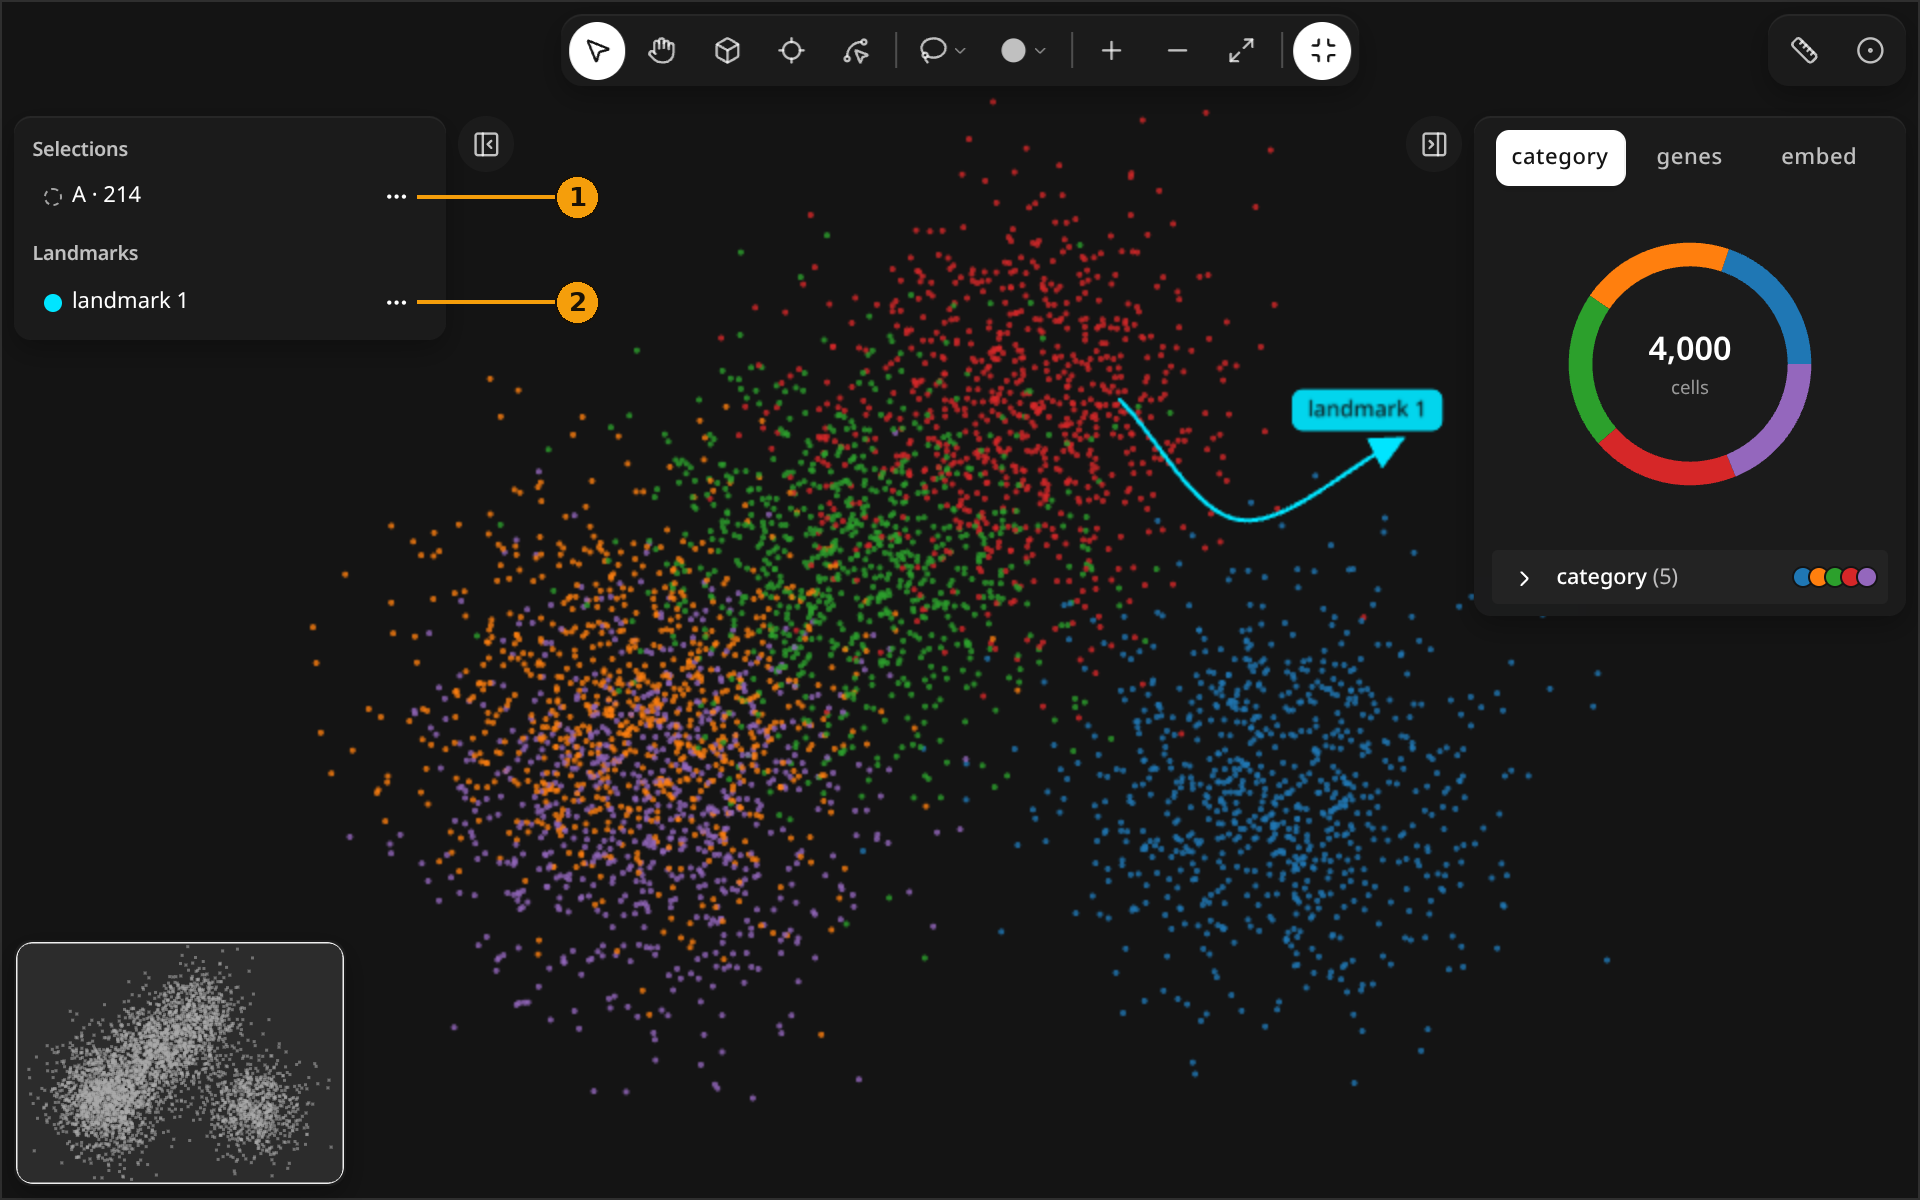
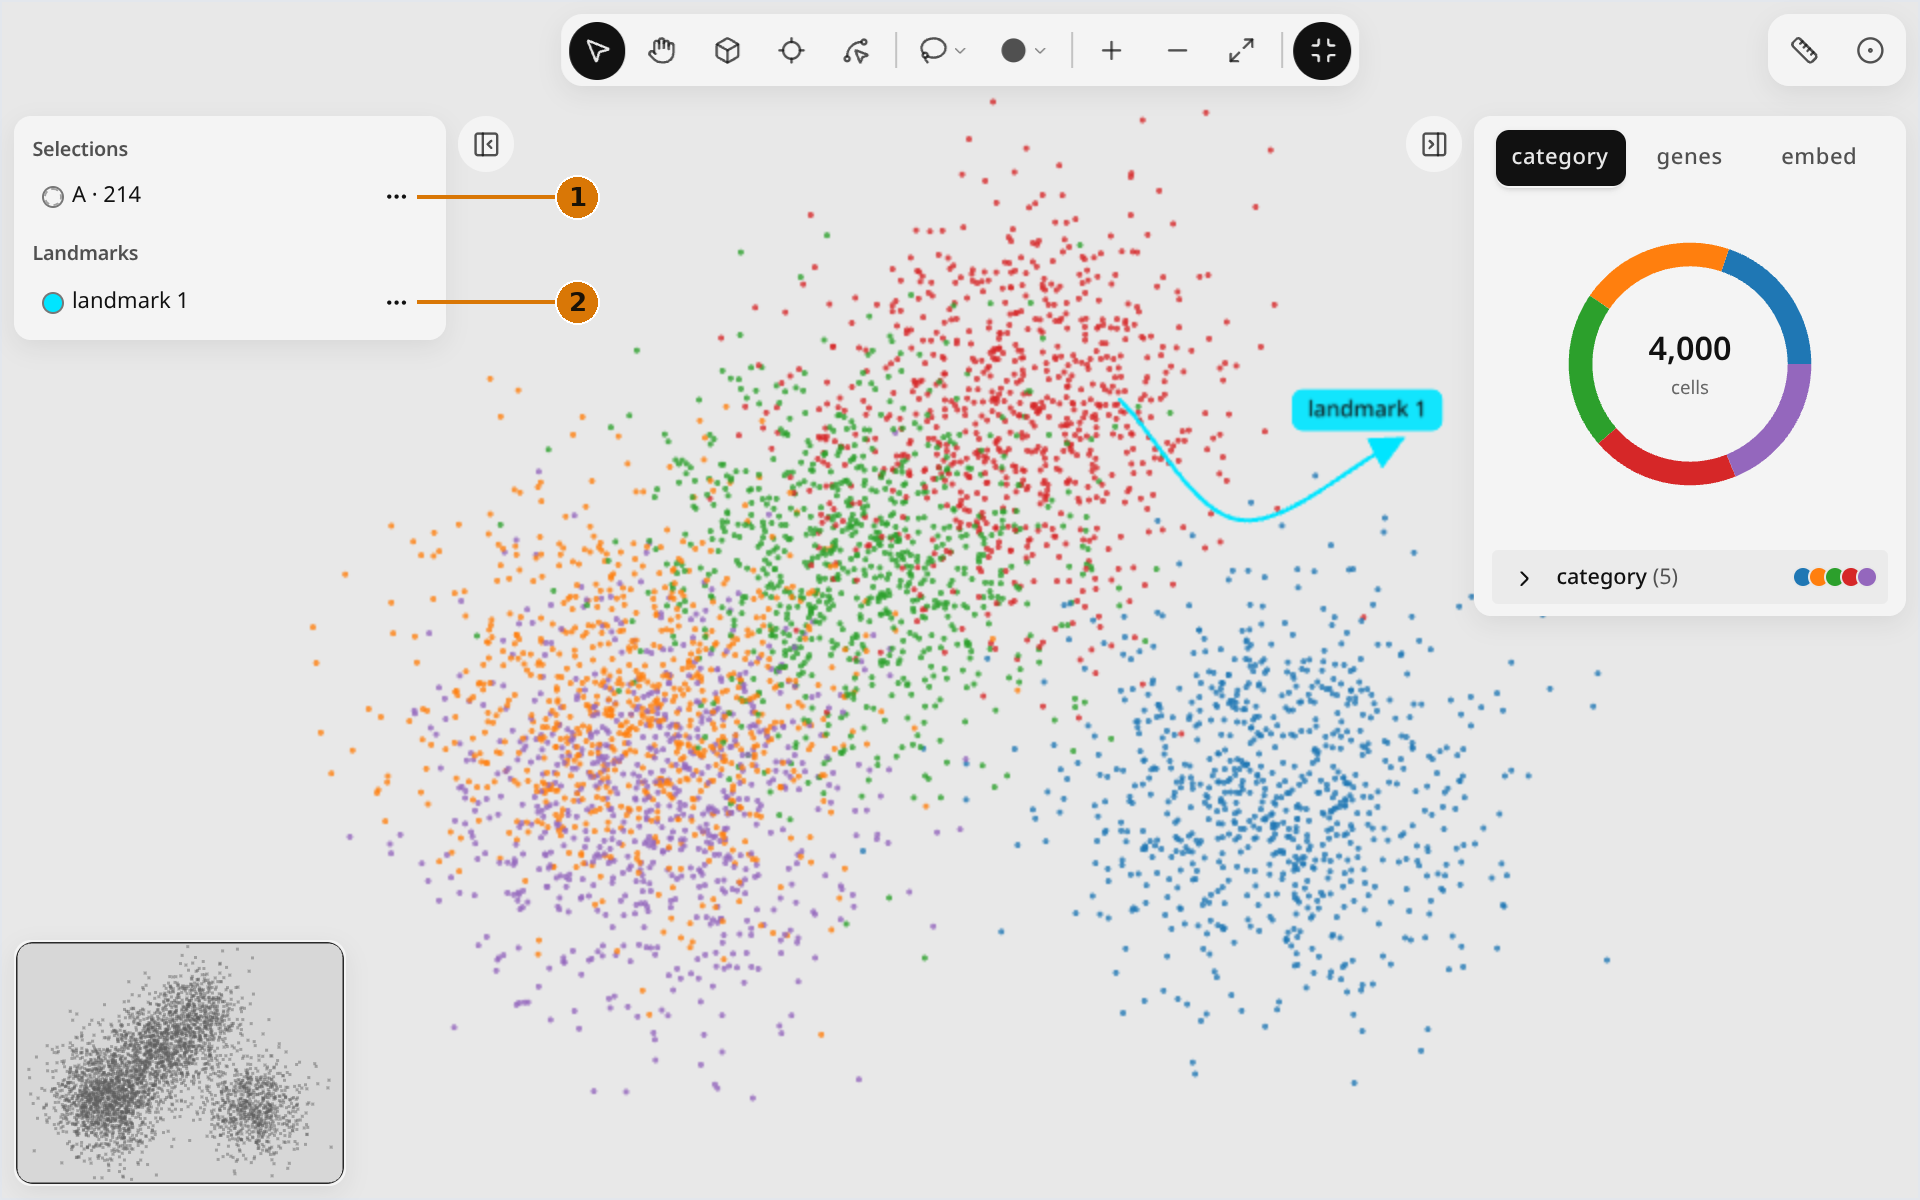
The left panel lists every selection and landmark.
| Control | What it does | |
|---|---|---|
| 1 | Selections | Click a row to make that selection active. |
| 2 | Landmarks | Click a row to select the landmark and open its context toolbar. |
| Layer actions | Hide / Show, Rename, Delete. | |
| Collapse left panel ([) | Hide the list; see Navigate. |
Python
w.set_render_mode("raster")       # or "points"
w.category_colors("cell_type")    # {label: hex}, as the map draws it
See Methods for set_color, set_raster_basis and the rest.